Overview
Feature Overview
| Item | Content |
|---|---|
| Applicable Role | Model Provider and Model Consumer |
| Navigation Path | AI Infra(On-Prem) > Overview |
| Page Route | /powerone/overview |
| Managed Object | Configuration, status, and relationships on Overview |
Beginner Explanation
The overview page can be understood as the homepage of the On-Prem user console: the upper area tells you which models can be deployed and which accelerators are available; the middle area provides quick entrypoints for Online IDE and Runtime Instance; the lower area helps you confirm whether quota is sufficient and whether resources have consumption records.
Terms
| Term | Description |
|---|---|
| Specification | Resource package that a job can request, such as CPU, memory, GPU model, and card count. |
| Quota | Resource upper limit available to a tenant. Common dimensions include GPU, CPU, memory, and specifications. |
| Accelerator | GPU, NPU, or other AI computing device, displayed on the page by vendor and model. |
Recommended Operation Order
Confirm prerequisites for Deployment templates, accelerator resources, quick entrypoints, specification quotas, and resource usage trends, follow Main Operations, run Result Validation, and continue to the next page.
First-Time User Notes
Confirm that the task involves Configuration, status, and relationships on Overview, and then follow the recommended order. If fields or state differ from expectations, check prerequisites before continuing downstream.
Prerequisites
- The current account can enter the
AI Infra(On-Prem)subsystem. - The operator has opened visible regions, availability zones, clusters, specifications, and templates for the tenant.
- To create an online IDE, runtime instance, or model instance, the account needs the corresponding creation permissions and available quota.
Page Description
Use this page to review deployment templates, accelerator resources, quick entries, specification quotas, and resource-usage trends.
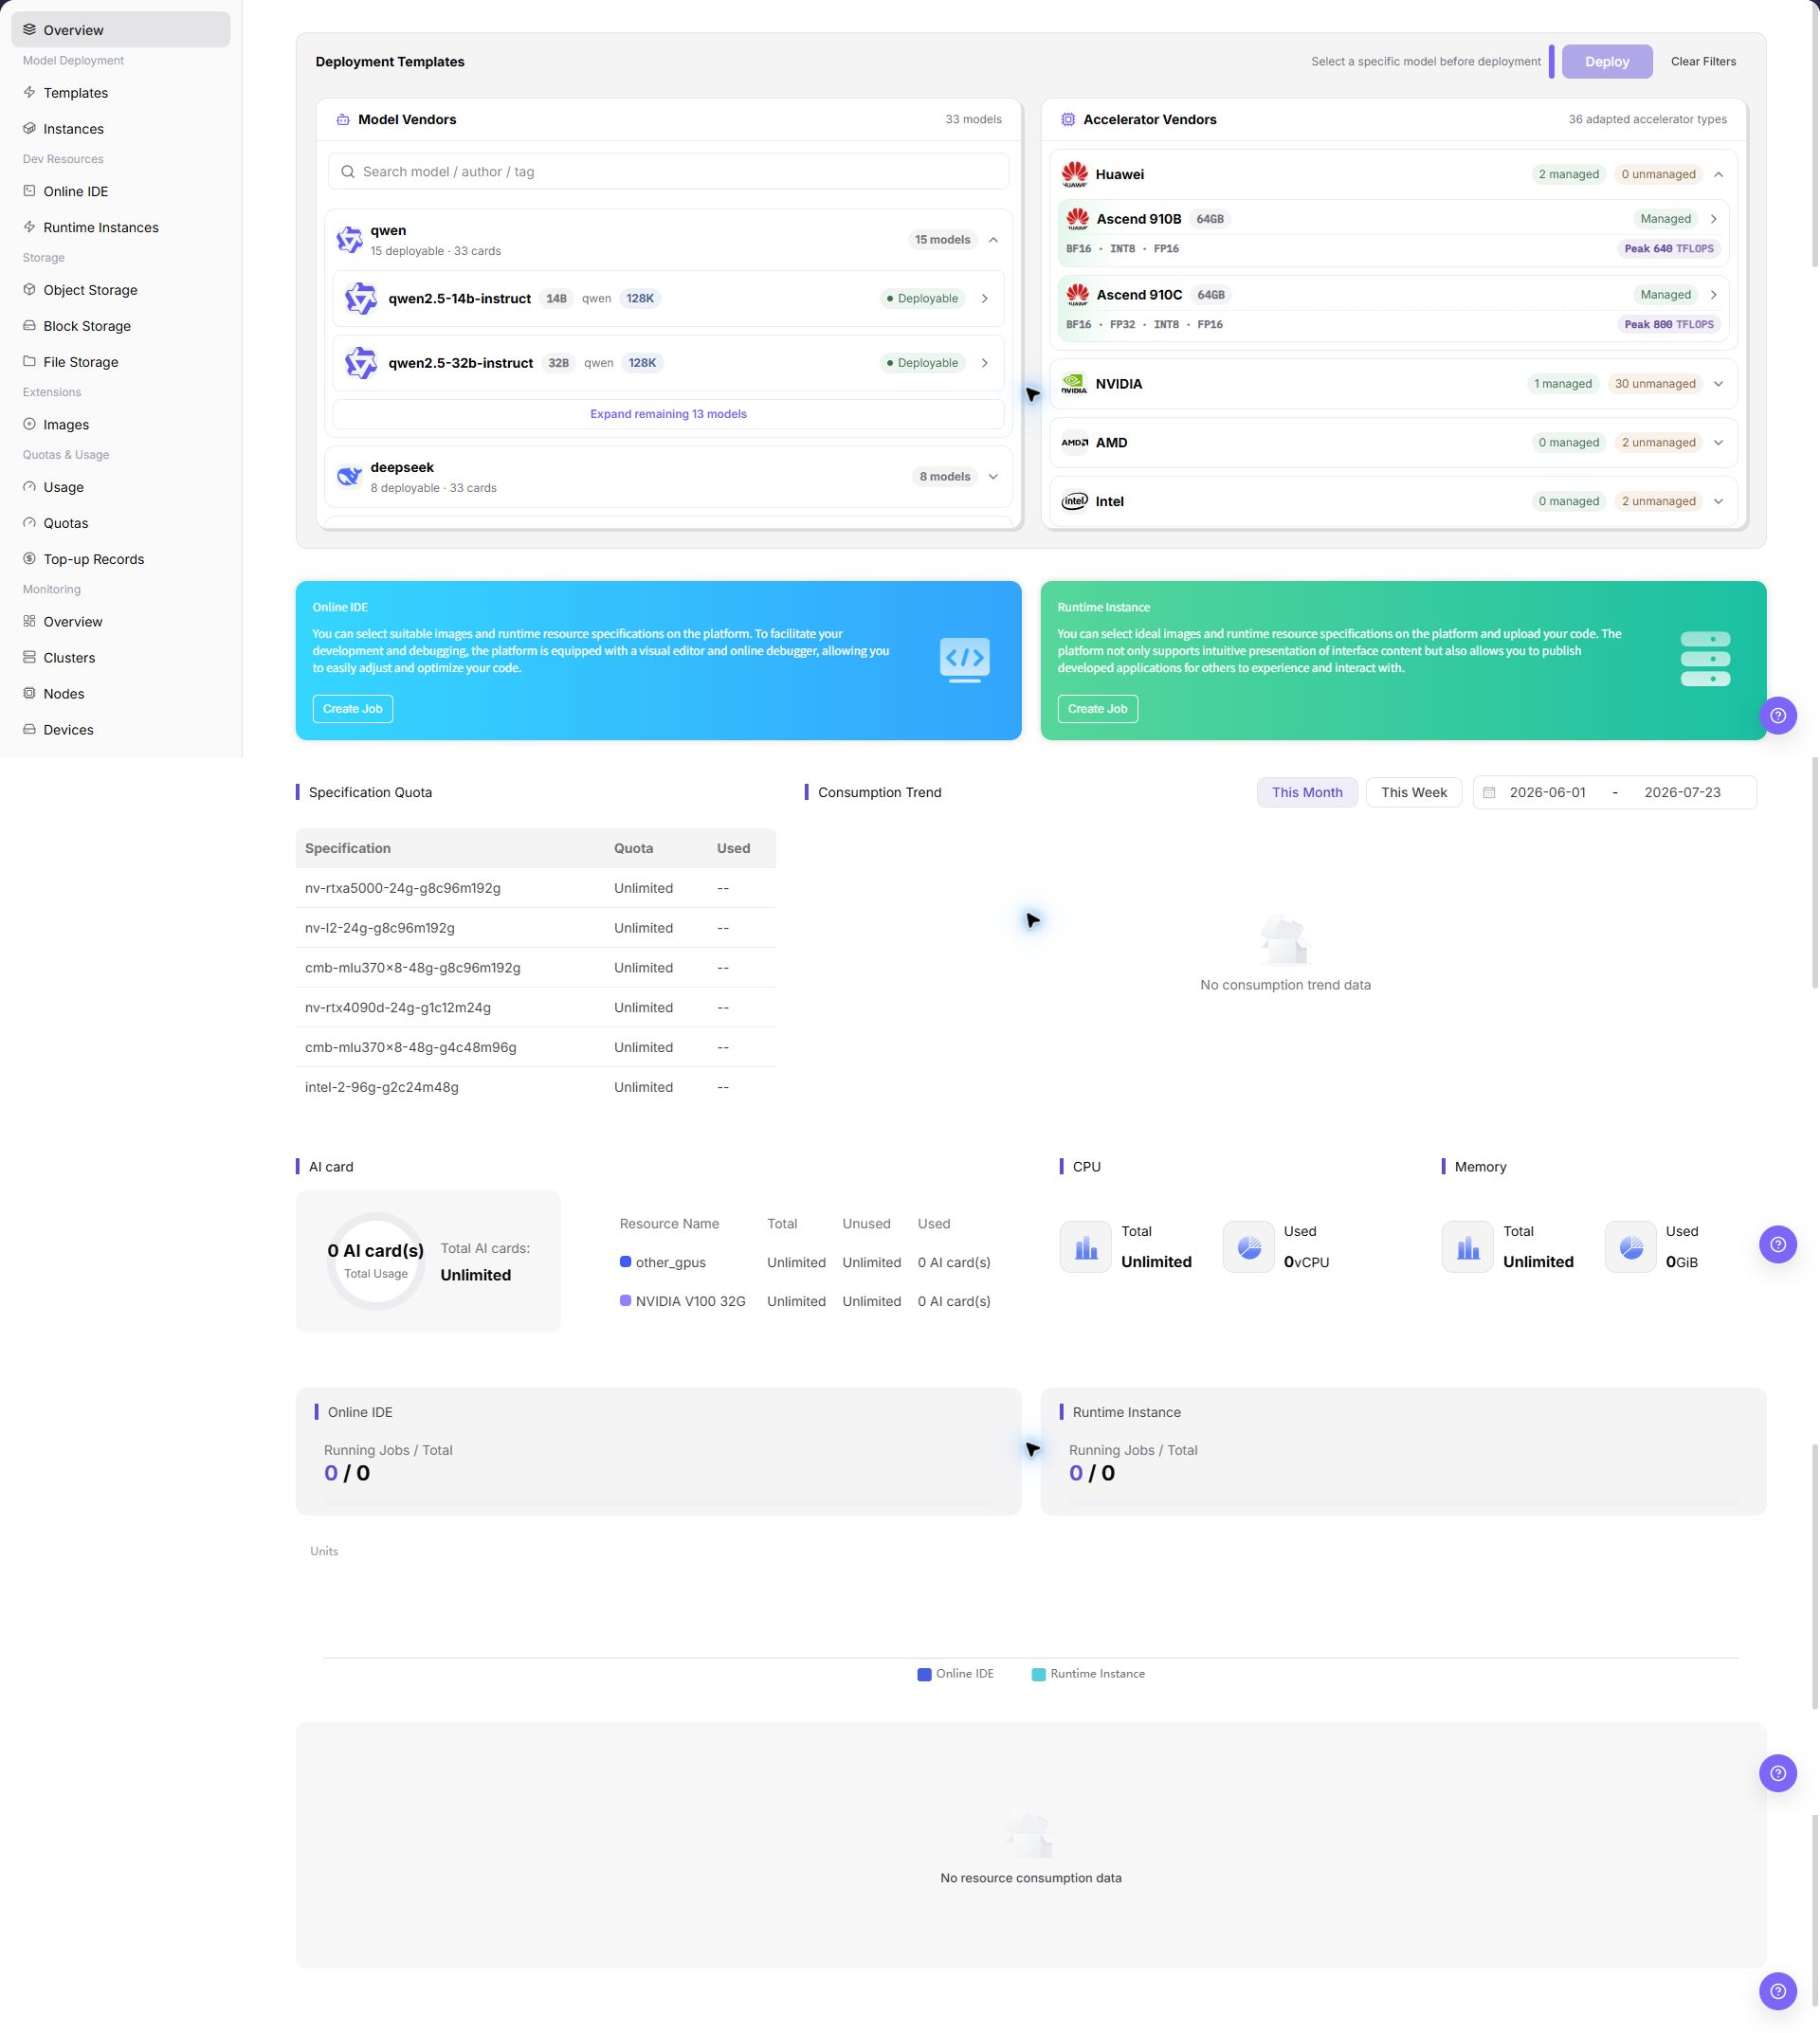
The upper area displays deployable templates and accelerator vendors; the middle area provides quick entrypoints for Online IDE and Runtime Instance; the lower area displays specification quota, consumption trends, and resource usage. The screenshot shows the left user menu, deployment template area, accelerator area, and quick entrypoints.
Page Areas
| Field/Area | Description |
|---|---|
| Deployment Templates | Displays deployable models and deployment entrypoints. The deployment button is usually unavailable before a model is selected. |
| Accelerator Vendors | Displays accelerator models and adaptation status by vendors such as NVIDIA, Huawei, AMD, and Intel. |
| Quick Guide | Provides creation entrypoints for Online IDE and Runtime Instance. |
| Specification Quota | Displays specification-level quotas and used amount. |
| Consumption Trend | Displays consumption trend for the current cycle. If there is no job consumption, it is empty. |
Main Operations
View Deployable Resources
- Open the On-Prem overview page and confirm the region and project scope in the upper-right corner.
- In deployment templates and accelerator vendor sections, review adapted hardware models, VRAM, and availability status.
- Check specification quotas and resource consumption trends to verify whether sufficient compute allowance remains.
Troubleshoot Quota or Resource Anomalies
- If available quota is insufficient or a target specification cannot be deployed, record the flavor model and region.
- Go to
Quotas & Usage > Quota Usageto verify allocated quotas and consumption records for the current tenant or project. - If quota is sufficient but deploying an instance still fails scheduling, check monitoring and availability zone status to verify whether physical cards are fully occupied.
Parameter Quick Reference
| Field Name | Required | Field Type | Example | Description |
|---|---|---|---|---|
| Region | No | Drop-down | Sample region | Overview statistics region. |
| Resource Type | No | Enum | Sample resource type | Overview resource category. |
| Quota | System-generated | Number | Sample quota | Available quota for the current account. |
| Used Amount | System-generated | Number | Sample used amount | Current used resource amount. |
| Update Time | System-generated | Date time | Sample update time | Overview data update time. |
Pitfalls
When the deployment button is unavailable, usually no model or accelerator has been selected.
Sufficient quota does not mean the cluster definitely has idle resources. If creation fails, check region, availability zone, and specifications.
Do not record real tenants, regions, clusters, specifications, resource usage, consumption data, or test parameters.
Overview data may have statistical delays. For troubleshooting, verify again on instance details, monitoring, or quota pages.
Result Validation
| Check Item | Success Signal | If Abnormal |
|---|---|---|
| Page entry | Overview opens with filters or statistics | Check menu permission, current business identity, and tenant scope |
| Data scope | Lists or statistics match the selected time, region, and object | Reset filters and verify time boundaries, time zone, and aggregation scope |
| Data update | Update time or latest record matches the expected cycle | Check whether the source job, metering, or quota record has been generated |
| Cross-check | Configuration, status, and relationships on Overview matches its details, billing, or monitoring records | Compare the responsible detail page by object identifier and time range |
FAQ
No Records on Overview
Symptom:
The page opens, but lists or statistics are empty.
Possible Causes:
- Filters are too narrow.
- source records are not generated.
- the role cannot see them.
Solution:
- Reset filters
- verify the source job or metering cycle
- check business identity and tenant scope.
Overview Shows the Wrong Scope
Symptom:
Data does not belong to the expected time, region, or object.
Possible Causes:
- Time boundaries differ.
- the region filter did not apply.
- ownership changed.
Solution:
- Select time and region again
- verify object identifiers
- confirm ownership in source details.
Overview Is Delayed
Symptom:
A source operation completed, but its record is not visible.
Possible Causes:
- Aggregation is not complete.
- the page is cached.
- source state is still processing.
Solution:
- Verify source state
- wait one aggregation cycle and refresh
- inspect the processing task if delay persists.
Details or Download Is Unavailable
Symptom:
The details, expand, or download entry is disabled.
Possible Causes:
- The record does not support it.
- role permission is insufficient.
- the file is not generated.
Solution:
- Select an eligible record
- check role permission
- confirm the statistics or export task is complete.
Summary and Details Do Not Match
Symptom:
The summary differs from the total of individual records.
Possible Causes:
- Periods differ.
- values are rounded.
- some records are still processing.
Solution:
- Align period and time zone
- compare by object
- wait for pending records and check again.
Notes
- Do not judge failure causes only by the homepage summary. Key instance status should be based on the corresponding detail page.
- Before creation, confirm region, specification, and image source to avoid creation failure caused by unschedulable resources after submission.
- The overview page only provides summary display and does not replace creation, detail, or troubleshooting pages of specific modules.
- Templates, specifications, and accelerators are configured by operators. Model Consumers cannot modify them directly on the overview page.
Next Steps
- Go to
Model Deployment > Deployment Templatesto create a model instance. - Go to
Development Resources > Online IDEto create an interactive development environment. - Go to
Quota & Usage > Resource Quotasto view resource limits.